
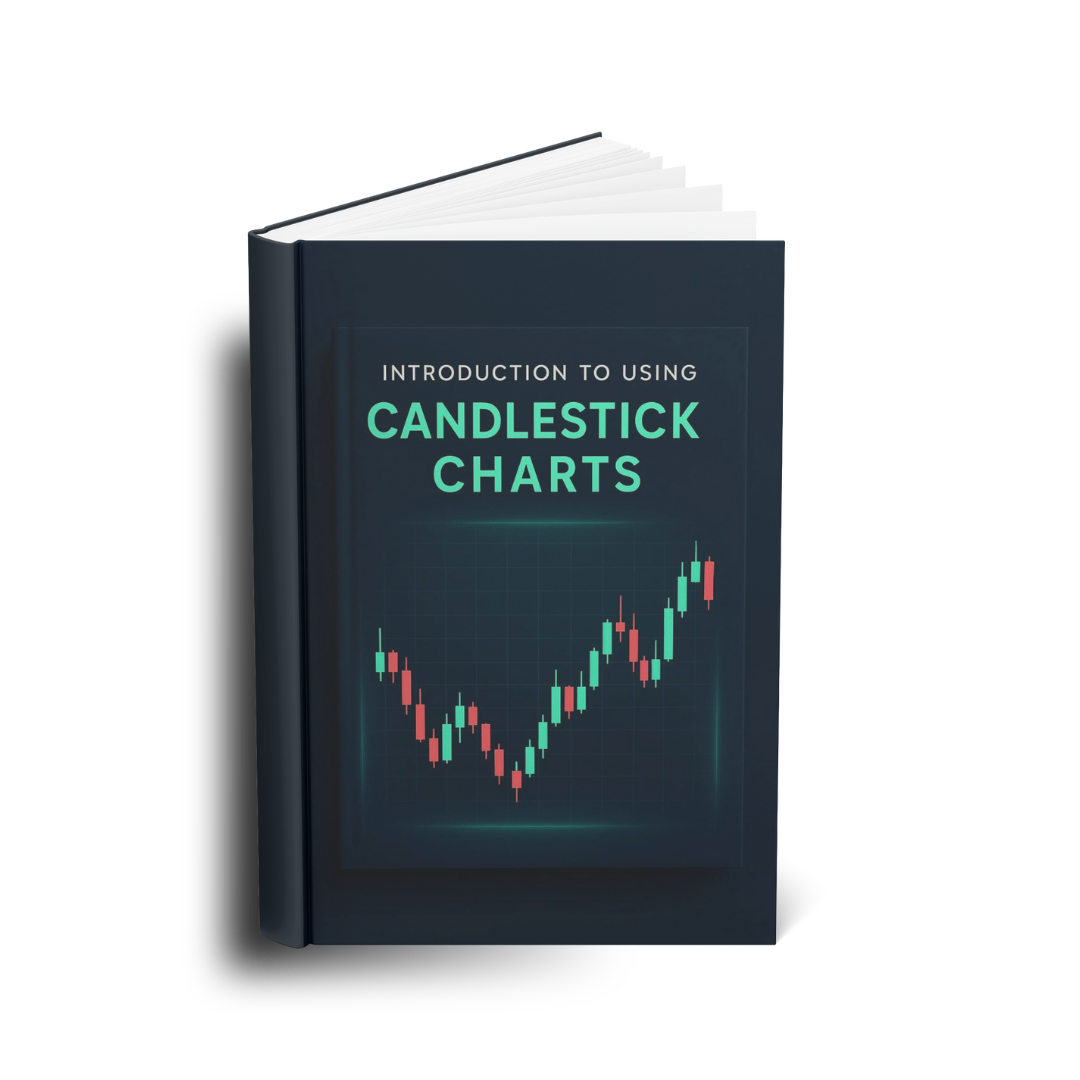
Introduction To Using Candlestick Charts Course
Understand candlestick charts quickly and use them to identify trends, reversals, and better entries.
Use Promo "FX20" to get additional discount.
Here's What You'll Learn !

How Candlestick Charts Are Constructed?
Understand open, high, low, close data and how candlesticks visually show market direction compared to traditional bar charts.
The Psychology Behind Market Movement
Learn how every candle represents a battle between buyers and sellers, showing fear, greed, strength, weakness, and sentiment shifts.
Advanced Doji Variations
Learn the meaning of gravestone, dragonfly, and rickshaw man doji and how their wick structures signal shifts in sentiment.
How to Use Candlesticks With Trend Context?
Discover why trend direction matters and how candles behave differently in uptrends, downtrends, and consolidation phases.
How to Apply Chart Patterns in Real Trading?
Learn why no pattern works alone, how to test historical behavior, and how to refine your approach using real market data.
How Many Lessons And Sections Are Included?
-
6–10 beginner-friendly sections
-
20–35 short, easy-to-follow lessons
-
Downloadable PDFs, examples, and charts for practice
-
How Long Does It Take To Complete The Course?
Most students complete it in 1–7 days, but it’s entirely self-paced. There is no time limit learn at your own speed.
What Additional Benefits Come With This Course?
- Live instructor support. ask questions anytime
- Optional WhatsApp support
- Premium signals included, depending on your selected plan
- Lifetime access to all course content
- Regular course updates whenever new strategies are added
- Access from mobile or desktop, anywhere, anytime
- A progress tracker to monitor course completions
Risk-free Purchase: Full refund within 14 days
Master Forex Trading Faster with Practical Lessons, Real-Time Guidance & Actionable Strategies

Beginner-Friendly Kickstart
Start strong with a clear roadmap, simplified basics, and step-by-step guidance to build your foundation the right way.

Complete Forex Curriculum
Learn Forex trading lesson-by-lesson charts, entries, risk management, strategies, and real market examples explained in depth.

Live Chat Support
Get your doubts cleared instantly. Message anytime and receive real, practical answers to keep your learning smooth.

Free WhatsApp Signals
Receive daily high-probability Forex signals directly on WhatsApp so you can learn and earn side-by-side.

Strategy Playbooks & Checklists
Download ready-to-use trading playbooks and checklists that help you enter, manage, and exit trades with confidence.
Courses
Support@LearnForex.ai © 2025 LearnForex.ai